Performance Profiling in zot
Use zot's built-in profiling tools to collect and analyze runtime performance.
The profiling capabilities within zot allow a zot administrator to collect and export a range of diagnostic performance data such as CPU intensive function calls, memory allocations, and execution traces. The collected data can then be analyzed using Go tools and a variety of available visualization tools.
If authentication is enabled, only a zot admin user can access the APIs for profiling.
localhost:8080.
What data is available?
The zot source code incorporates golang's pprof package of runtime analysis tools to collect data for the following performance-related profiles:
| Profile | Description |
|---|---|
| allocs | A sampling of all past memory allocations. |
| block | Stack traces that led to blocking on synchronization primitives. |
| cmdline | The command line invocation of the current program. |
| goroutine | Stack traces of all current goroutines. Use debug=2 as a URL query parameter to export in the same format as an unrecovered panic. |
| heap | A sampling of memory allocations of live objects. You can specify the gc GET parameter to run GC before taking the heap sample. |
| mutex | Stack traces of holders of contended mutexes. |
| profile | CPU usage profile. You can specify the duration in the seconds URL query parameter. After receiving the profile file, use the go tool pprof command to investigate the profile. |
| threadcreate | Stack traces that led to the creation of new OS threads. |
| trace | A trace of execution of the current program. You can specify the duration in the seconds URL query parameter. After you get the trace file, use the go tool trace command to investigate the trace. |
To return a current HTML-format profile list along with a count of currently available records for each profile, use the following API command:
/v2/_zot/pprof/
How do I export profile data?
To collect and export any available profile, use the following API command format:
/v2/_zot/pprof/<profile-type>[?<query-parameters>]
The following example shows an API request for the CPU usage profile named profile using a collection window of 30 seconds:
$ curl -s http://localhost:8080/v2/_zot/pprof/profile?seconds=30 > cpu.prof
This command example creates an output data file named "cpu.prof".
- The query parameter
?seconds=<number>specifies the number of seconds to gather the profile data. If this parameter is not specified, the default is 30 seconds. - In this example, the raw output data is redirected to a file named "cpu.prof". Alternatively, you can use
curl -Oto create a file with the default profile name (in this case, "profile"). If no output file is specified by either a cURL flag or an output redirection, the cURL command fails with "Failure writing output to destination". - The command output file is in a machine-readable format that can be interpreted by performance analyzers.
Analyzing the CPU usage profile using go tool pprof
Go's pprof package provides a variety of presentation formats for analyzing runtime performance.
For detailed information, see the pprof documentation.
Generating a pprof web presentation
When an HTTP port is specified as a command flag, the go tool pprof command installs and opens a local web server that provides a web interface for viewing and analyzing the profile data. This example opens a localhost page at port 9090 for viewing the CPU usage data captured in the profile file named "cpu.prof".
$ go tool pprof -http=:9090 cpu.prof
Serving web UI on http://localhost:9090
The pprof web view offers several options for viewing and interpreting the collected performance data. Select VIEW to see the available options:
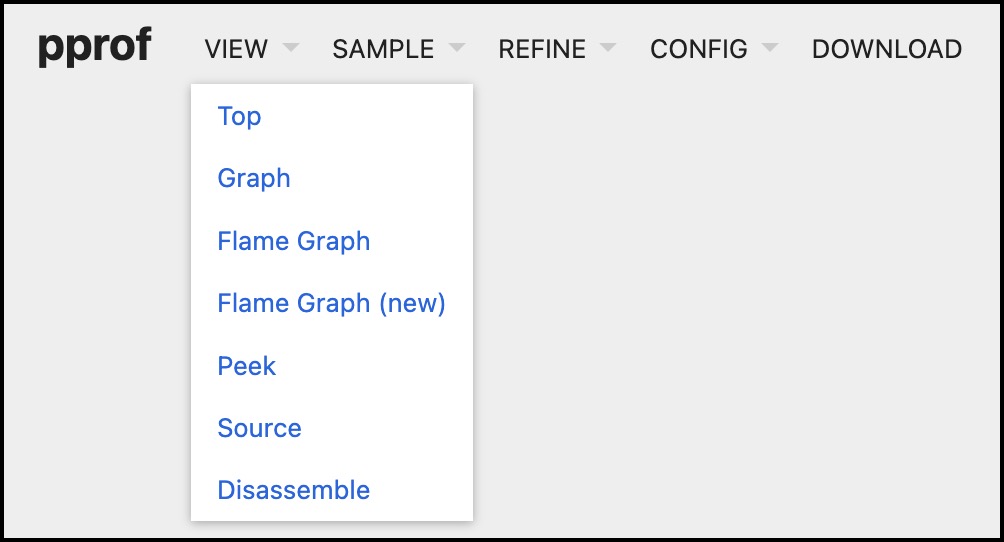
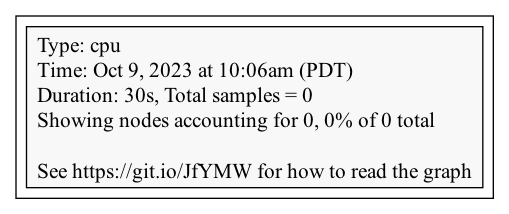
A Flame Graph can be very useful for analyzing CPU usage:

Generating a graphic image
The pprof package can generate graphic representations of profile data in many formats. This example generates a PNG file representing the CPU usage in the "cpu.prof" file.
$ go tool pprof -png cpu.prof
Generating report in profile001.png
Opening a pprof interactive session
This example opens an interactive session with pprof and executes the pprof top command, which displays the top ten modules by CPU usage during the profiling capture window.
$ go tool pprof cpu.prof
Type: cpu
Time: Sep 26, 2023 at 10:01am (PDT)
Duration: 30s, Total samples = 10ms (  0.1%)
Entering interactive mode (type "help" for commands, "o" for options)
(pprof) top
Showing nodes accounting for 10ms, 100% of 10ms total
    flat  flat%   sum%        cum   cum%
    10ms   100%   100%       10ms   100%  runtime.pthread_cond_signal
        0     0%   100%       10ms   100%  runtime.findRunnable
        0     0%   100%       10ms   100%  runtime.mcall
        0     0%   100%       10ms   100%  runtime.notewakeup
        0     0%   100%       10ms   100%  runtime.park_m
        0     0%   100%       10ms   100%  runtime.runSafePointFn
        0     0%   100%       10ms   100%  runtime.schedule
        0     0%   100%       10ms   100%  runtime.semawakeup
(pprof)
Analyzing the trace profile using go tool trace
You can collect trace data with the trace profile, as in this example:
$ curl -s -v http://localhost:8080/v2/_zot/pprof/trace?seconds=30 > trace.prof
Using the go tool trace package, you can analyze the trace data captured in the "trace.prof" example file:
$ go tool trace trace.prof
2023/09/21 16:58:58 Parsing trace...
2023/09/21 16:58:58 Splitting trace...
2023/09/21 16:58:58 Opening browser. Trace viewer is listening on http://127.0.0.1:62606
The go tool trace command installs and opens a local web server that provides a web interface for viewing and analyzing the trace data.
As an alternative, you can generate a pprof-like profile from the trace file using the following command:
$ go tool trace -pprof=[net|sync|syscall|sched] <filename>
For example:
$ go tool trace -pprof=net trace.prof